Skip to content
Property intelligence

What a property is, in four layers of evidence.

Deep Oʻahu builds one record for each of ≈326,000 Oʻahu properties out of four separable layers: what a public authority published, the geometry and the aerial capture, what follows deterministically from those two, and the measurements of the physical property itself. Every layer says which one it is.

Free. No account required.

The whole of Oʻahu on the Deep Oʻahu map, every parcel shaded by assessed value, with the legend and the layer control visible.
Every parcel on the island, one colouring at a time.
The Deep Oʻahu map on a phone, with one Oʻahu parcel selected over 2024 aerial imagery and its property sheet docked below.
Every parcel on the island, one colouring at a time.
The ladder

Four layers, and what each one can be asked.

They are kept apart on purpose. A field somebody else published, a calculation we ran, and an observation a model made are three different kinds of claim, and the page tells you which one you are reading.

  1. Layer 01. The public record, kept whole.

    Seven public-record sources and seventeen datasets, fused by TMK into one record per property. Around 320 fields, each kept with the date its source published it, and none of them rewritten into a score.

    ~320
    public-record fields captured
    432,021
    building permits, 2005–2025
    See one field with its provenance →
    What layer 01 includes
    • Assessed value: total, land, building, exemptions, net taxable, tax year
    • Owner of record, tax-bill mailing address, and the owner-occupant signal
    • Building record: year built, floors, dwelling count, floor area
    • Lot size, legal description, zoning class and its description
    • Land tenure, mapped cesspool evidence, short-term-rental registration
    • Permit history on the parcel, 2005–2025
    • Sales and transfer record from the county deed record
    • Condo and CPR units resolved to the parcel they actually sit on
  2. Layer 02. Geometry, and the island photographed.

    Every parcel on Oʻahu as a mapped boundary, under the county's own 2024 aerial capture — self-hosted, served from our own tiles, and attributed wherever it appears.

    ≈172,000
    parcels mapped, the whole island
    7.94 cm
    per aerial pixel at the deepest level
    See the capture →
    What layer 02 includes
    • ≈172,000 parcel polygons, the whole island
    • City and County of Honolulu 2024 aerial imagery, 7.94 cm/pixel at the deepest level
    • 1,714 FEMA flood-zone polygons
    • 1,965 county zoning polygons
    • 10,805 mapped cesspools on Oʻahu
    • ~1,400 registered short-term rentals
  3. Layer 03. What follows from the first two.

    Reproducible geometry over the layers beneath it. Two boundaries either overlap or they do not; the same inputs give the same answer every time, and we will show you which two shapes were compared.

    See a derivation →
    What layer 03 includes
    • Whether a parcel boundary intersects a FEMA flood-zone polygon, and which zone
    • Whether it falls inside the State 3.2 ft sea-level-rise inundation area
    • Whether a mapped cesspool sits on it, and the replacement-priority band
    • Which properties sit on a parcel, and which parcel a condo unit belongs to
    • How far the nearest traffic counter or modelled road profile is
    • Which of the five Hawaiʻi checks pass, and which rule a property failed
  4. Layer 04. The physical property itself.

    Measuring what a record cannot describe: what can be seen from a property, how steep it is, what could be built beside it, and what has physically changed. Each measurement carries the evidence it was drawn from.

    See the whole intelligence layer →
    What layer 04 includes
    • What can be seen from a property, and what blocks it
    • What the ground and the zoning envelope allow
    • What the building and the roof measure
    • What has physically changed, and what condition it is in
Layer 02

Every parcel, under the county's own capture.

One flight, flown in 2024, self-hosted and served from our own tiles — not a stitched mosaic of somebody else's basemap.

Aerial imagery of an Oʻahu neighbourhood at close range: individual houses, driveways, pools, garden beds and street trees are separately legible.
City and County of Honolulu 2024 aerial imagery, 7.94 cm/pixel at the deepest level, self-hosted.

At the deepest level the capture resolves 7.94 cm per pixel, which is close enough to read a driveway, a hedge line and a lānai apart. Parcel boundaries are drawn over it from the State's Oʻahu parcel layer, so what you are looking at and what the record describes are the same object.

Open the map

Every capture is attributed to the authority that flew it and dated to the year it was flown, so a measurement drawn from imagery can always be placed in time.

Layer 03

A calculation you can check.

Every derivation on this layer is geometry over a published boundary, and the page names both shapes it compared.

Whether a property sits in a flood zone is not a judgement. It is whether its parcel boundary intersects a FEMA polygon, and if it does, which zone that polygon carries. The same holds for the State's 3.2 ft sea-level-rise inundation area, for the mapped cesspool inventory, and for resolving which of ≈326,000 properties sit on which of ≈172,000 parcels.

When a property fails one of the five Hawaiʻi checks, the product says which rule it failed rather than dropping it silently — so a result you did not expect is something you can argue with.

An overlap between a parcel boundary and a hazard polygon is a fact about two maps. It is not a statement about a building, a person, a meter or an insurance outcome, and we do not write it as one.

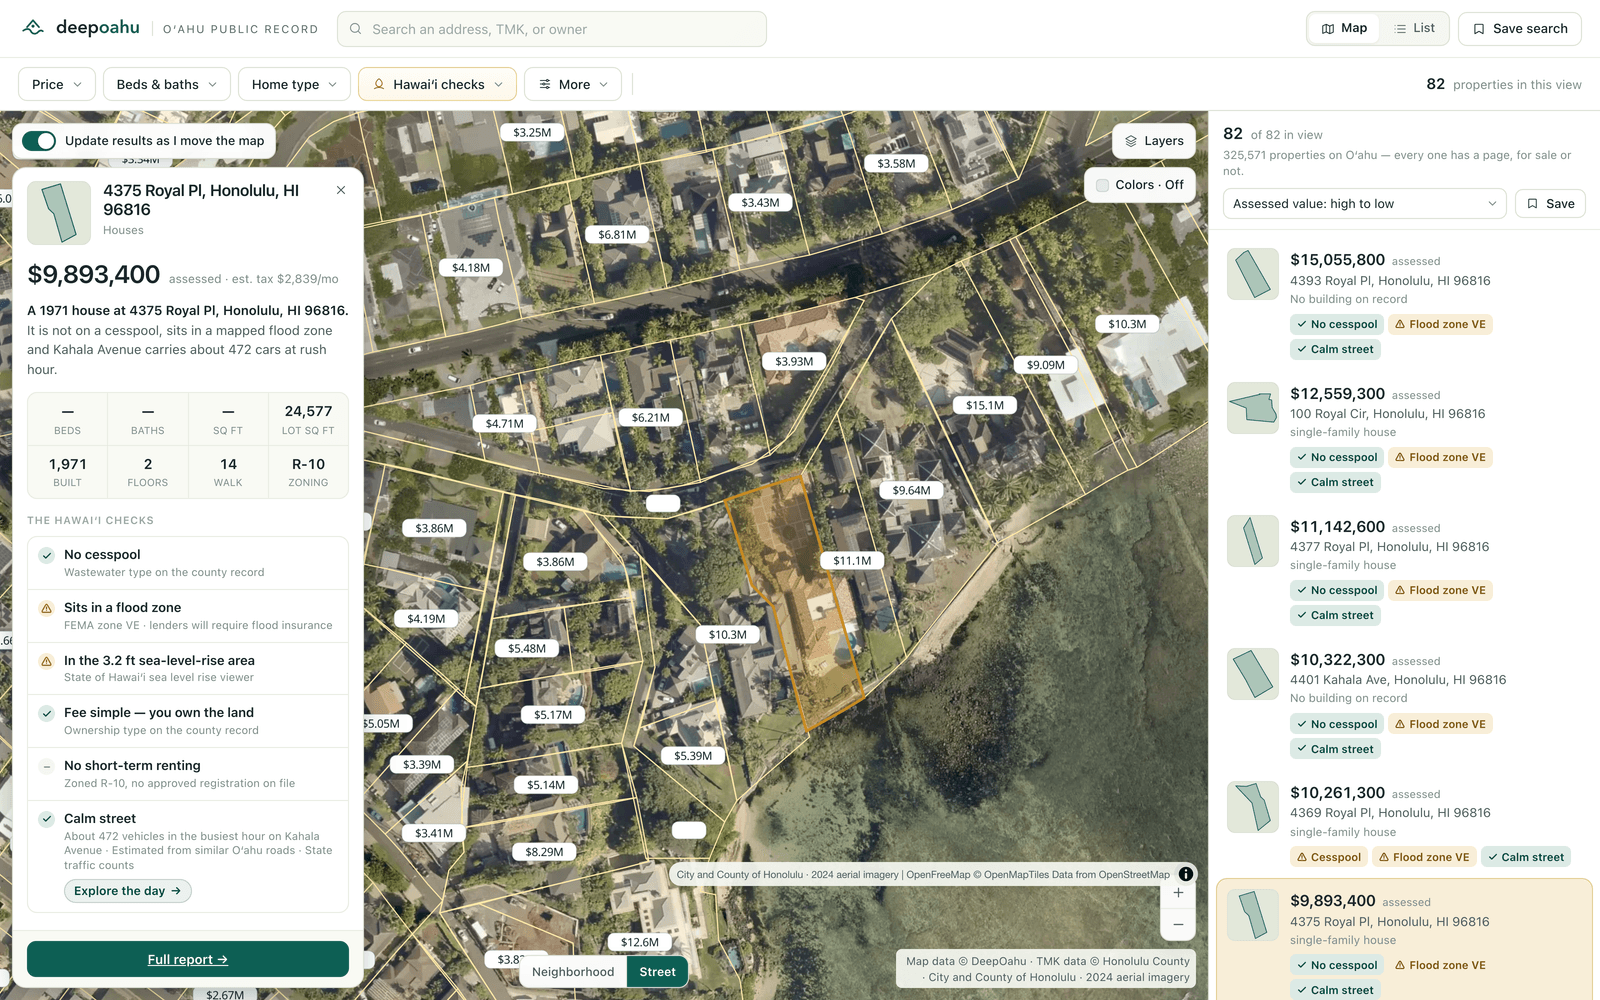
One Oʻahu parcel selected on the map over 2024 aerial imagery, with a panel listing its Hawaiʻi checks — cesspool, flood zone, sea-level-rise area, land tenure and short-term rental — each naming the county record behind it.
One parcel, and the checks derived from its boundary. Each line names the record it came from.City and County of Honolulu 2024 aerial imagery, 7.94 cm/pixel at the deepest level, self-hosted.

Layer 04: the property itself, measured.

The intelligence layer, on top of the record and the geometry.

Public records describe a property on paper. They do not say what can be seen from it, how steep it is, what could be built beside it, or how exposed its outdoor space is. Deep Oʻahu measures those things from geospatial evidence and publishes each one with the evidence class it belongs to and the inputs it was computed from.

A measurement is not a record, and the page never sets them in the same type. Each one carries its class, its confidence where a model produced it, and the date of the inputs behind it.

How a view measurement would be constructed, drawn as a section through a property A side view of a house on sloping ground above the water. From an observer point inside the upper storey, two lines open out toward the horizon. A neighbouring structure crosses the lower part of that opening, splitting it into an open sector above and a blocked sector below. The four numbered markers are explained in the list beneath the drawing.1234
  1. Observer pointA chosen height on the property — a floor level, a lānai, a window — rather than the centre of the lot.
  2. Open sectorHow much of the horizon is unobstructed from that point, measured as an angle rather than asserted as a word.
  3. ObstructionThe structure or terrain that closes part of the sector, named rather than left implicit.
  4. Blocked sectorWhat is not visible, and which obstruction accounts for it. An unexplained score is not an answer.

What this layer answers.

  • True view measurement

    The open sector from a chosen point on the property, with the structure or terrain that closes the rest of it named.

  • Future-view obstruction risk

    The same measurement recomputed against a modelled neighbouring buildout, so you can see what a plausible building next door would take away.

  • Lot and driveway slope

    Slope across the building site and along the access to it.

  • Roof and building measurement

    Roof area, pitch, orientation and complexity, and the building footprint under it.

  • Privacy and exposure

    How exposed the outdoor space is to roads, neighbouring structures and elevated ground.

  • Sun and shadow

    Modelled sun and shadow across a parcel through the day and through the year.

  • Development potential

    What the zoning envelope allows on the parcel, read against the ground it actually sits on.

  • Physical change detection

    What has changed on the ground, read across the aerial record for the parcel.

  • Aerial history

    The capture record for the parcel, so a structure can be placed in time rather than only in space.

  • Property condition

    Condition observed from imagery, published as an observation with its confidence and the evidence it was drawn from.

  • Source provenance on every measurement

    Which class of evidence produced it, which inputs it was computed from, and when those inputs were published.

Read how we separate facts from inference →

Methodology

How we know what we show you.

Four classes of evidence, kept apart on every page, so you always know which kind of claim you are reading.

01

Source facts

Fields published by an identified public authority — the county assessment roll, the State's parcel and zoning layers, FEMA's flood mapping, the Department of Health's cesspool inventory, the county permit record. We keep every field a source publishes, and we keep its date.

02

Deterministic calculations

Reproducible geometry: whether this parcel intersects the sea-level-rise area, how far the nearest traffic counter is, which properties sit on this parcel. The same inputs give the same answer, every time, and the inputs are named.

03

AI-assisted observations

Model inferences, such as classifying what is visible in imagery. Each carries a confidence value and the evidence it was drawn from, and each is labelled an observation rather than a fact.

04

Provenance on every field

Which class of evidence produced this number, which source it came from, and when that source last published. If you disagree with a field, the county's own record is one click away.

Three classes, on one property.

Land tenure

Leasehold

Evidence class
Source fact
Source
City and County of Honolulu, Real Property Assessment Division — ownership-type record
Last published
2026 assessment roll

A decoded county field. It is not a title opinion, and it says nothing about the ground-lease term, rent or buyout.

FEMA flood zone

Zone AE · Special Flood Hazard Area

Evidence class
Deterministic calculation
Source
Calculated from the mapped parcel boundary and the FEMA flood-zone polygon
Last published
Recomputed on every rebuild

An overlap between two mapped shapes, and a regulatory designation. It is not a risk assessment and it is not an insurance determination.

What is visible from the property

Open ocean sector, partially obstructed

Evidence class
AI-assisted observation
Source
Geospatial evidence over the parcel and its surroundings
Last published
Recomputed on every rebuild

Published as an observation, in the fixed pattern: "Model observation · confidence 0.7 · not a verified fact."

Deep Oʻahu is a research tool, not a survey, appraisal, title report, or legal opinion. Verify anything material with the authoritative source or a licensed professional.

Start with one address.

Open the map and look up a property you already know. Every line you find has a source and a date beside it, and the county's own record is one click away.